Technical case study / v2.0.2
Seismic Correlation and Insurance Loss
Emmanuel Randle's earthquake catastrophe-risk model linking spatial correlation, portfolio loss, reinsurance requirements, and parametric basis risk.
Project overview
I developed an end-to-end earthquake catastrophe-risk model that connects seismic source models and engineering damage with the financial metrics used in insurance, reinsurance, and risk transfer.
The model starts with the USGS 2018 National Seismic Hazard Model and progresses through rupture occurrence, stochastic event simulation, ground motion, structural and nonstructural damage, ground-up loss, insurance recovery, reinsurance, and parametric catastrophe-bond analysis.
The completed workflow contains 13 sequential notebooks. Phase 1 establishes a validated independent-residual baseline. Phase 2 introduces two spatial-correlation models while preserving the same event catalog, portfolio, policy terms, and paired random streams.
At a glance
| Item | Project value |
|---|---|
| Portfolio | 470 buildings in Seaside, Oregon |
| Replacement value | $384.24 million |
| Stochastic catalog | 2,000,000 years |
| Earthquake occurrences | 10,630 |
| Dependence cases | 3 |
| Modeling notebooks | 13 |
| Automated tests | 92 passing |
| Final critical validation failures | 0 |
Research question
A fair comparison requires more than running separate simulations. The project uses the same earthquake occurrences and paired random-number streams across all three dependence cases. This isolates changes caused by the spatial-dependence assumption from changes caused by different event samples or damage draws.
Catastrophe-risk workflow
Phase 1: validated baseline
Phase 1 creates the full hazard-to-financial-loss chain:
- rupture-level annual occurrence rates;
- a 2-million-year annual event catalog;
- PGA and SA(0.4 s) ground motions;
- structural and nonstructural damage states;
- ground-up and insured loss;
- occurrence excess-of-loss reinsurance;
- AAL, AEP, OEP, and PML.
The baseline includes a shared between-event residual and correlated PGA and SA(0.4 s) residuals at each site. Within-event residuals are conditionally independent between sites.
Phase 2: spatial-dependence extension
Phase 2 compares:
- I0: the Phase 1 independent-site baseline;
- C1: an Aldea et al. subduction spatial-correlation model;
- C2: a Goda–Atkinson spatial-correlation model.
The marginal residual distributions, cross-intensity-measure dependence, catalog, and random streams are held fixed. The main controlled change is the spatial dependence among portfolio locations.
Damage, insurance, and reinsurance
Ground motion is translated into three repair-cost components:
- structural damage;
- nonstructural drift-sensitive damage;
- nonstructural acceleration-sensitive damage.
A synthetic insurance policy applies a deductible equal to 10% of each building’s replacement value. The financial calculations track ground-up, uninsured, gross insured, ceded, and retained losses.
The frozen occurrence excess-of-loss program has:
| Term | Value |
|---|---|
| Attachment | $18.81 million |
| Occurrence limit | $61.84 million |
| Participation | 100% |
The project also evaluates alternative occurrence layers, standalone annual aggregate protection, and aggregate protection stacked after the frozen occurrence program.
Key findings
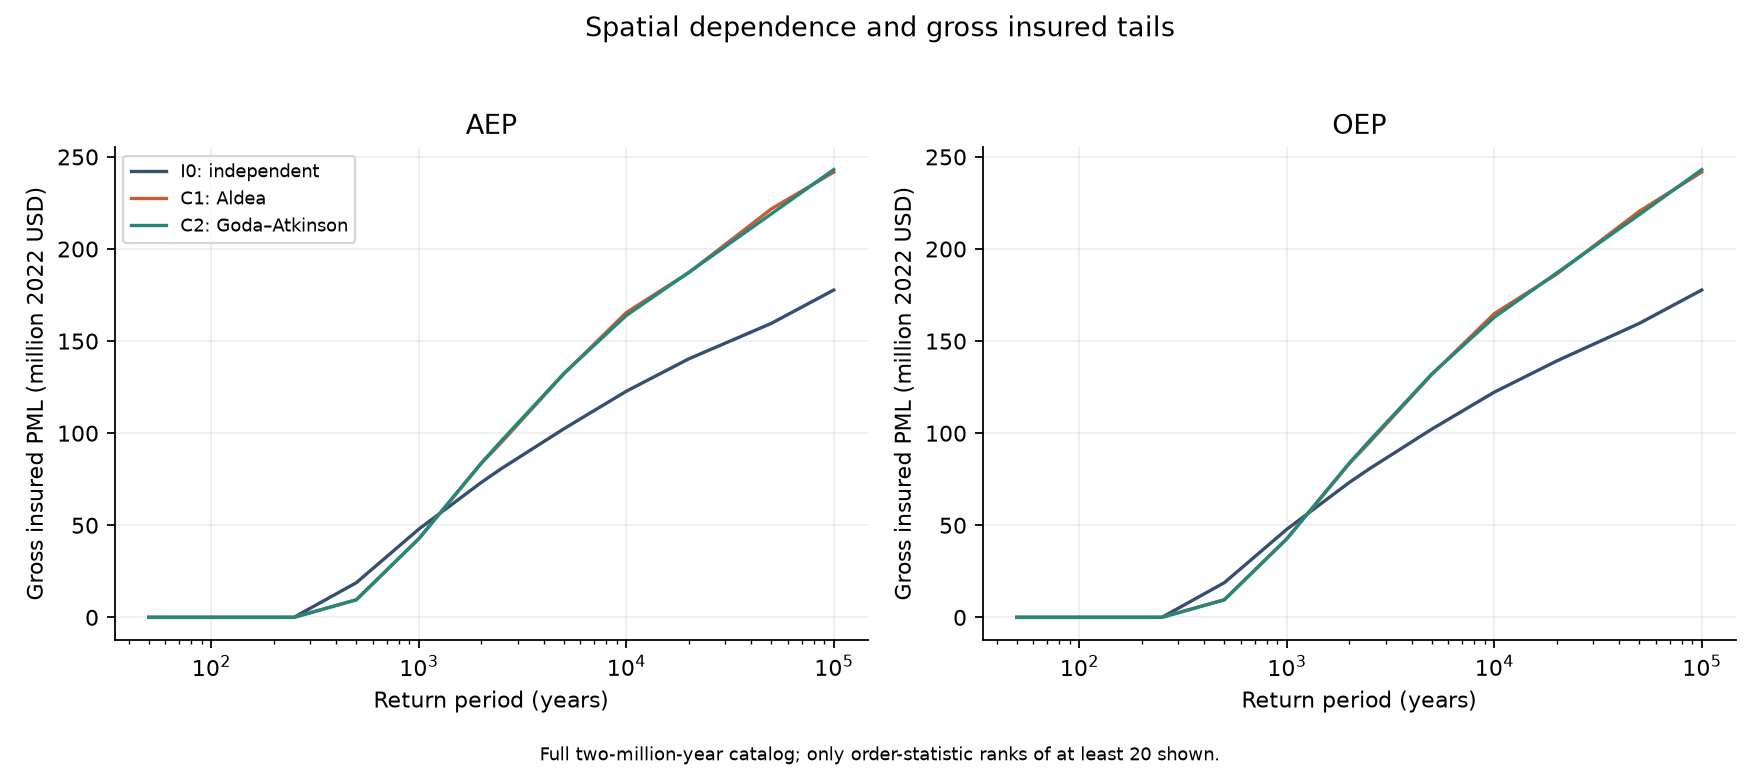
1. Spatial correlation changes retained tail risk more clearly than expected loss
The small gross insured AAL differences have paired bootstrap intervals that include zero. The simulation therefore does not establish a resolved AAL effect.
The retained tail results are materially different. Under the same frozen occurrence excess-of-loss terms:
| Case | Gross insured AAL | Ceded AAL | Retained 2,500-year AEP PML |
|---|---|---|---|
| I0: independent | $122,979.56 | $63,676.60 | $19.36 million |
| C1: Aldea | $123,443.43 | $58,654.69 | $33.27 million |
| C2: Goda–Atkinson | $123,335.68 | $58,604.14 | $34.08 million |
The stored paired uncertainty intervals for the retained 2,500-year PML differences exclude zero.
2. Fixed reinsurance terms do not preserve equivalent protection
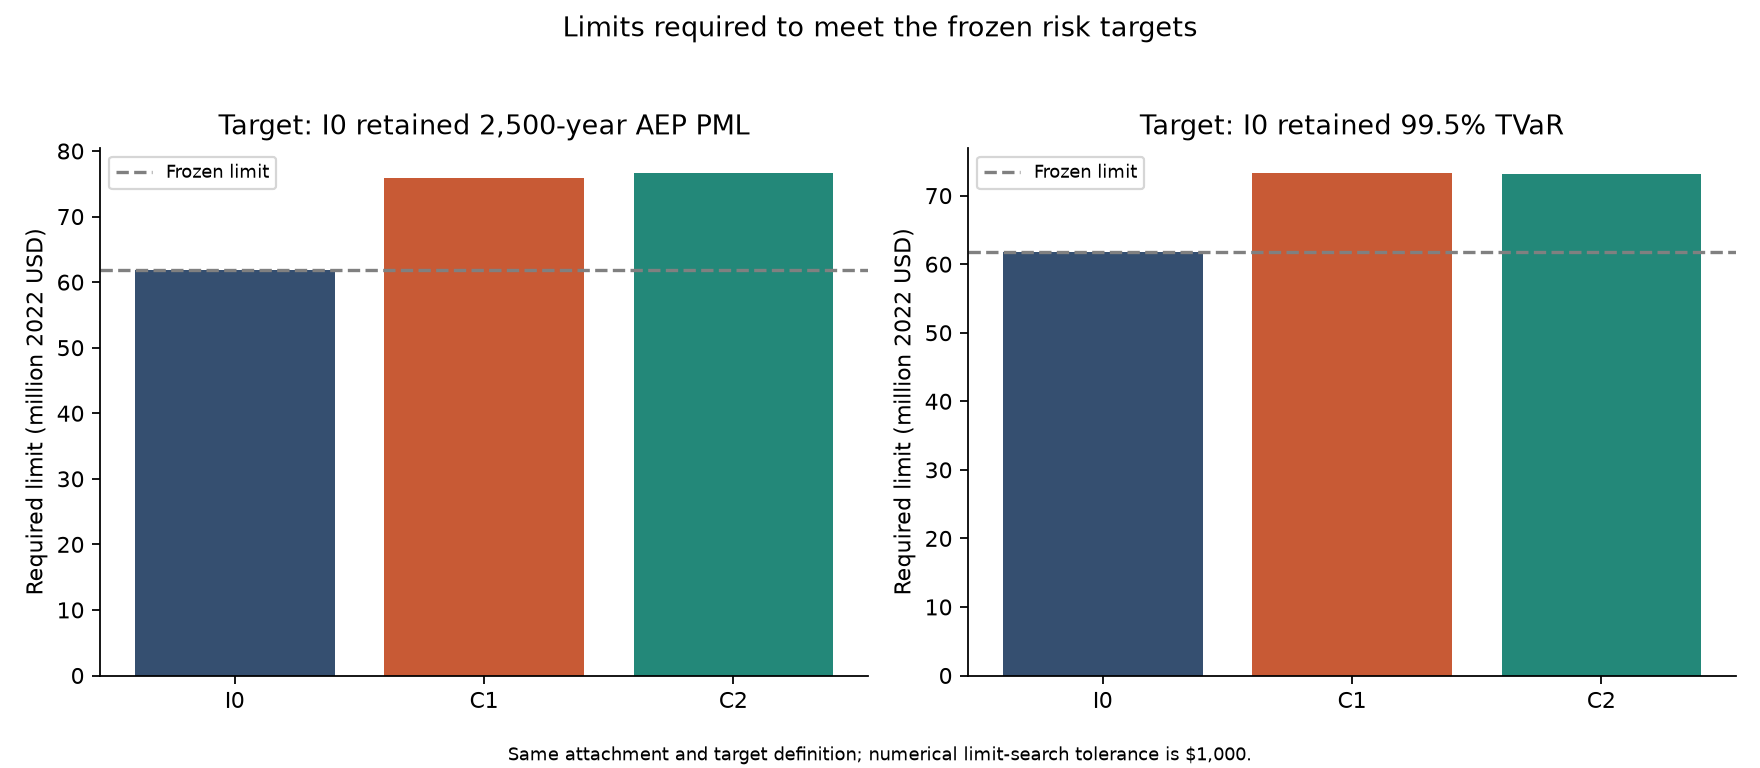
Using the same attachment, the occurrence limit required to restore the independent case’s retained 2,500-year PML increases under spatial correlation:
| Case | Required occurrence limit |
|---|---|
| I0: independent | $61.84 million |
| C1: Aldea | $75.90 million |
| C2: Goda–Atkinson | $76.67 million |
These are conditional model results calculated with a $1,000 numerical search tolerance. They are not recommended insurance placements.
3. Parametric protection introduces visible basis risk
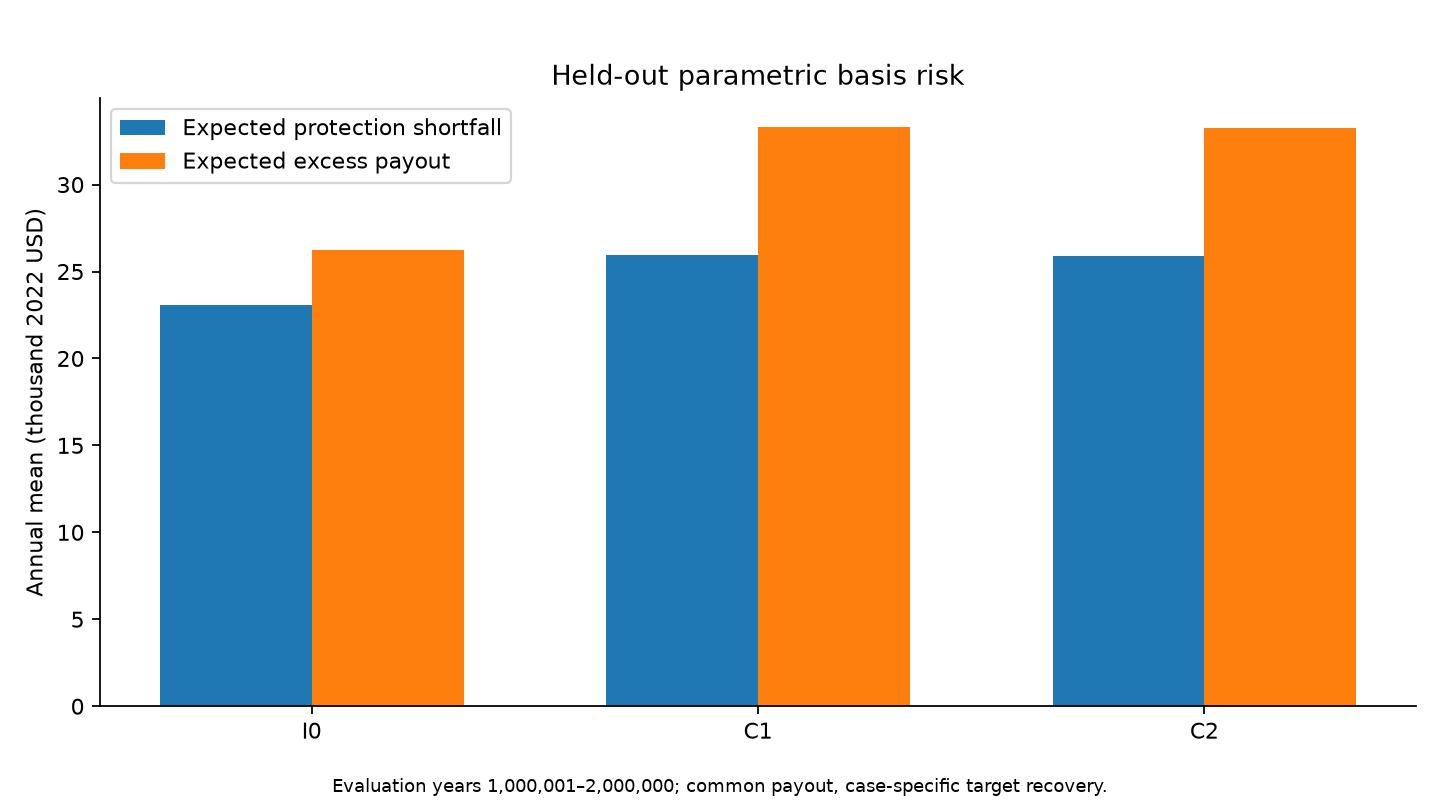
A source-based magnitude-distance trigger is calibrated using catalog years 1 through 1,000,000 and frozen before evaluation on years 1,000,001 through 2,000,000.
The same collateralized payout vector is applied across all dependence cases, so the comparison does not refit the trigger to each loss result. The evaluation tracks protection shortfall, excess payout, collateral depletion, cash net loss, unfunded loss, and surplus separately.
Validation and reproducibility
The workflow is deterministic, restartable, and designed for audit.
It includes:
- frozen configuration records;
- common event catalogs and paired random streams;
- chunked processing for large tables;
- row-count, uniqueness, and schema checks;
- accounting reconciliation at building, event, and annual levels;
- SHA-256 hashes and artifact inventories;
- explicit zero-event years in annual loss series;
- paired bootstrap uncertainty;
- repository-level tests and validation.
The completed release passed:
- 92 automated tests;
- 65 upstream artifact checks, with no skipped checks;
- 14 final synthesis checks;
- zero critical validation failures.
Interpretation limits
This is a transparent research and portfolio demonstration rather than a production catastrophe model or insurance quotation.
The results are conditional on:
- one synthetic 470-building portfolio in Seaside, Oregon;
- the USGS NSHM release and selected ground-motion assumptions;
- HAZUS-style fragility and repair-cost approximations;
- synthetic insurance, reinsurance, and parametric terms;
- building repair loss only;
- no contents, business interruption, demand surge, claims inflation, or reinstatement pricing;
- limited order-statistic support at the most extreme return periods.
Sparse annual losses also make selected VaR measures non-informative. TVaR and supported PML measures are used for the substantive tail comparisons. RAROC outputs are transparent assumption grids, not market pricing estimates.